
Valve
Indicator of multiple values from given range with labels.
Explore the capabilities, screenshots, features, and resources for this control.
Overview
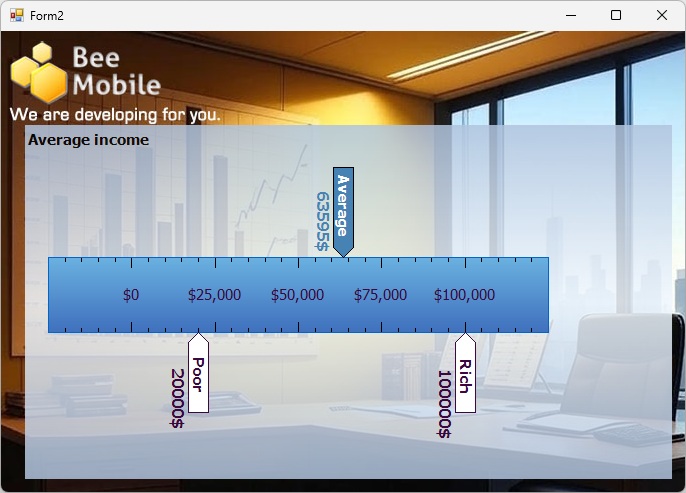
The idea of Valve is to graphically visualize value from a certain range of values. Just like a valve, which can be fully open, fully closed and then somewhere between these two extremes.
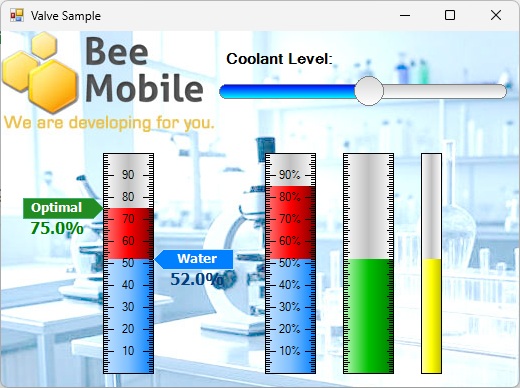
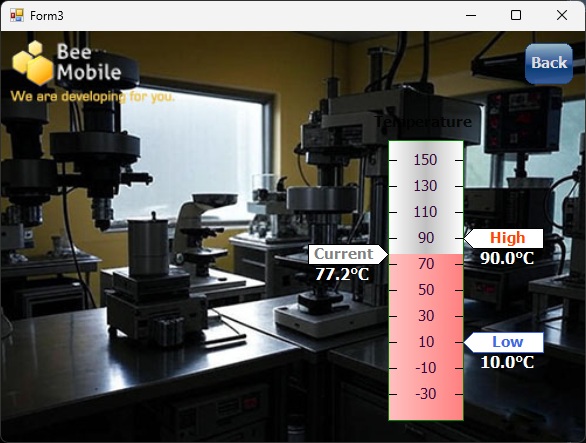
Valve does this by drawing a rectangular indicator, highlighting its minimum, maximum and current values. Valve is capable of drawing a number scale with tick marks. The labels over tick marks are generated automatically, but custom labels can also be provided. Finally, Valve is capable of drawing textual labels, highlighting importance of certain values on the valve’s scale (optimal value, critical value, error value, danger value, etc.).
Valve can have a vertical or horizontal orientation. Check out the sample project and try it out yourself.
Screenshots
Features
- Visualize values from a range.
- Apply custom labels to highlight critical values.
- Visualize a scale with tick marks or apply custom tick marks.